

구글 차트의 간략한 사용법과 반응형 적용법을 알아보자.
자세한 사용법은 공식 문서를 확인
API 연결하기
<script type="text/javascript" src="https://www.gstatic.com/charts/loader.js"></script>차트 만들기
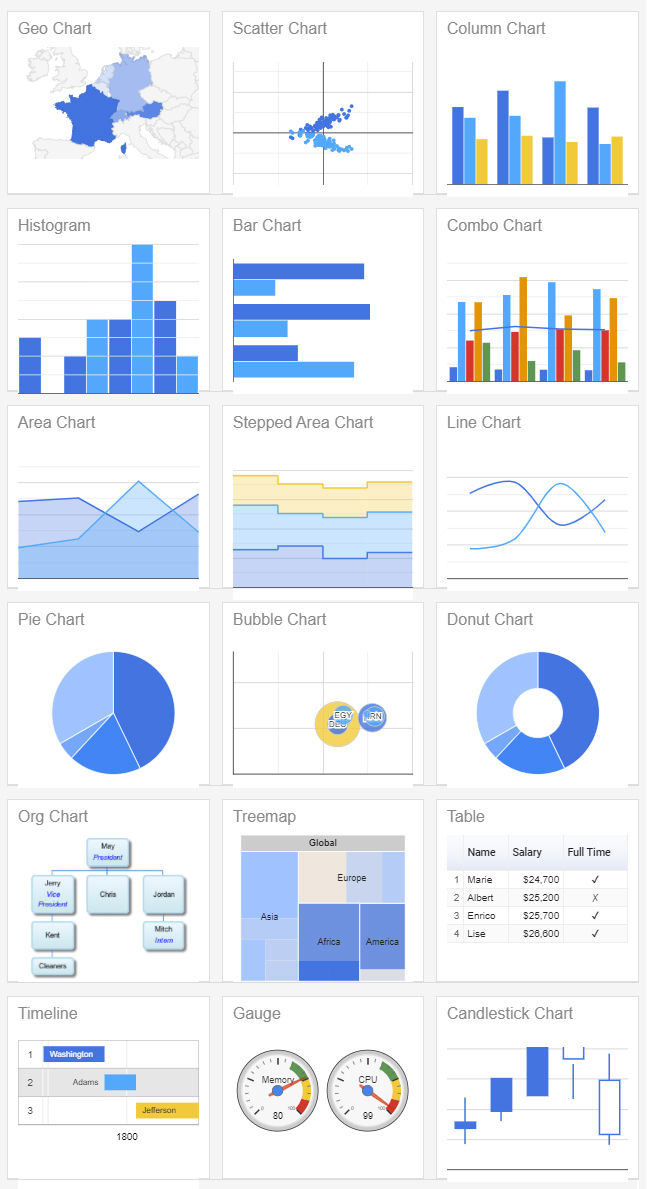
원하는 차트 유형 선택
아래 차트 리스트에서 원하는 유형을 선택하여 클릭
HTML(마크업) 추가
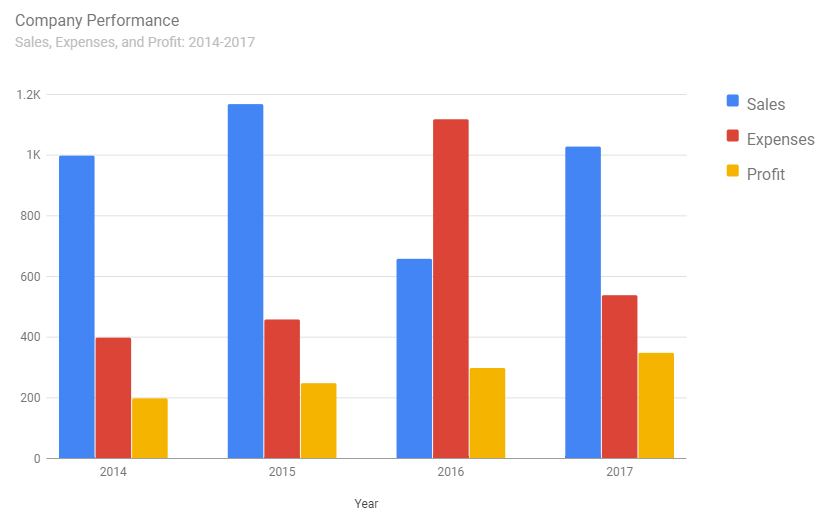
일반적으로 많이 사용하는 컬럼형 차트를 예시로 추가해보자.
아래와 같이 원하는 영역에 차트 마크업을 추가한다.
<div id="columnchart_material" style="width: 800px; height: 500px;"></div>스크립트 실행하기
google.charts.load('current', {'packages':['bar']});
google.charts.setOnLoadCallback(drawChart);

function drawChart() {
    var data = google.visualization.arrayToDataTable([
        ['Year', 'Sales', 'Expenses', 'Profit'],
        ['2014', 1000, 400, 200],
        ['2015', 1170, 460, 250],
        ['2016', 660, 1120, 300],
        ['2017', 1030, 540, 350]
    ]);

    var options = {
        chart: {
        title: 'Company Performance',
        subtitle: 'Sales, Expenses, and Profit: 2014-2017',
        }
    };

    var chart = new google.charts.Bar(document.getElementById('columnchart_material'));

    chart.draw(data, google.charts.Bar.convertOptions(options));
}
스크립트를 추가하면 아래와 같이 차트가 삽입된다.
반응형 차트 적용하기
See the Pen Responsive Google Charts by likeanewstar (@likeanewstar) on CodePen.
레이아웃
var options = {
    chart: {
    title: 'Company Performance',
    width: '100%' // 반응형을 위한 width 값 추가
    }
};
반응형 차트 적용은 비교적 간단하다.
See the Pen Responsive Google Charts by likeanewstar (@likeanewstar) on CodePen.
- 차트 마크업을 감싸는
<div>를 추가하여 원하는 width 값으로 CSS를 설정한다. - 실행문
options에서width를100%로 설정한다.
위와 같이 작업하면 PC 화면에서는 차트끼리 혹은 차트와 다른 콘텐츠를 가로로 나열했다가, 반응형 화면에서 세로로 위치하도록 작업할 수 있다.
단, API 특성상 브라우저 창을 리사이즈할 때마다 자동 적용되지 않고 리사이즈 후 새로고침을 해야 정상 작동한다.
모바일에서만 특정 옵션을 사용하고 싶은 경우
원하는 뷰포트의 사이즈를 조건문 처리한 후, 그 안에 원하는 옵션을 정의하여 사용
var options = {
    // 가로축 삭제
    title: '제목 내용',
    width: '100%'
}
var mq = window.matchMedia( "(max-width: 1024.98px)" );
if (mq.matches)
    var options = {
        legend: 'none'
    }
}
자주 사용하는 옵션 정리
제목 설정
var options = {
    title: '제목 내용', // 타이틀
    subtitle: '서브 제목 내용', // 서브 타이틀
    titlePosition: 'in', // 제목 위치 그래프 안
    titlePosition: 'out' // 제목 위치 그래프 밖
}
범례 제거, 숨김 (차트 종류에 따라 두 방법 중 하나의 방법 사용)
// pie 차트 등
var options = {
    legend: `none`
}
// bar, column 차트 등
var options = {
    legend: {
        position: 'none'
    }
}
축 제거
var options = {
    hAxis: {textPosition : 'none'}, // 가로축 제거
    vAxis: {textPosition : 'none'} // 세로축 제거
}'Tech > JavaScript' 카테고리의 다른 글
| CDN으로 IE에서 ES6 문법 사용하기 (0) | 2021.04.22 |
|---|---|
| Parameter와 Argument의 차이 (0) | 2021.04.13 |
| [JS] 바닐라 JS로 게임 만들기 (0) | 2019.08.03 |
| [JS] 바닐라 JS로 구글 크롬앱 만들기 #3 Make your first JS App - 2 (0) | 2019.07.30 |
| [JS] 팝업 - 오늘 하루 열지 않기 (0) | 2019.07.22 |